Golang runtime内存管理机制
工作中遇到一个golang项目内存占用非常多,于是根据pprof工具反馈的热点做了优化,优化后通过pprof能看出来改善明显,原来的热点几乎不见了,但是top上显示的RSS内存占用却没什么变化,于是用runtime.ReadMemStats想看下runtime自己统计的内存占用相关信息,这个函数返回的结构体MemStats:
type MemStats struct {

    // Alloc is bytes of allocated heap objects.
    //
    // This is the same as HeapAlloc (see below).
    Alloc uint64

    // TotalAlloc is cumulative bytes allocated for heap objects.
    //
    // TotalAlloc increases as heap objects are allocated, but
    // unlike Alloc and HeapAlloc, it does not decrease when
    // objects are freed.
    TotalAlloc uint64

    // Sys is the total bytes of memory obtained from the OS.
    //
    // Sys is the sum of the XSys fields below. Sys measures the
    // virtual address space reserved by the Go runtime for the
    // heap, stacks, and other internal data structures. It's
    // likely that not all of the virtual address space is backed
    // by physical memory at any given moment, though in general
    // it all was at some point.
    Sys uint64

    // Lookups is the number of pointer lookups performed by the
    // runtime.
    //
    // This is primarily useful for debugging runtime internals.
    Lookups uint64

    // Mallocs is the cumulative count of heap objects allocated.
    // The number of live objects is Mallocs - Frees.
    Mallocs uint64

    // Frees is the cumulative count of heap objects freed.
    Frees uint64

    // HeapAlloc is bytes of allocated heap objects.
    //
    // "Allocated" heap objects include all reachable objects, as
    // well as unreachable objects that the garbage collector has
    // not yet freed. Specifically, HeapAlloc increases as heap
    // objects are allocated and decreases as the heap is swept
    // and unreachable objects are freed. Sweeping occurs
    // incrementally between GC cycles, so these two processes
    // occur simultaneously, and as a result HeapAlloc tends to
    // change smoothly (in contrast with the sawtooth that is
    // typical of stop-the-world garbage collectors).
    HeapAlloc uint64

    // HeapSys is bytes of heap memory obtained from the OS.
    //
    // HeapSys measures the amount of virtual address space
    // reserved for the heap. This includes virtual address space
    // that has been reserved but not yet used, which consumes no
    // physical memory, but tends to be small, as well as virtual
    // address space for which the physical memory has been
    // returned to the OS after it became unused (see HeapReleased
    // for a measure of the latter).
    //
    // HeapSys estimates the largest size the heap has had.
    HeapSys uint64

    // HeapIdle is bytes in idle (unused) spans.
    //
    // Idle spans have no objects in them. These spans could be
    // (and may already have been) returned to the OS, or they can
    // be reused for heap allocations, or they can be reused as
    // stack memory.
    //
    // HeapIdle minus HeapReleased estimates the amount of memory
    // that could be returned to the OS, but is being retained by
    // the runtime so it can grow the heap without requesting more
    // memory from the OS. If this difference is significantly
    // larger than the heap size, it indicates there was a recent
    // transient spike in live heap size.
    HeapIdle uint64

    // HeapInuse is bytes in in-use spans.
    //
    // In-use spans have at least one object in them. These spans
    // can only be used for other objects of roughly the same
    // size.
    //
    // HeapInuse minus HeapAlloc estimates the amount of memory
    // that has been dedicated to particular size classes, but is
    // not currently being used. This is an upper bound on
    // fragmentation, but in general this memory can be reused
    // efficiently.
    HeapInuse uint64

    // HeapReleased is bytes of physical memory returned to the OS.
    //
    // This counts heap memory from idle spans that was returned
    // to the OS and has not yet been reacquired for the heap.
    HeapReleased uint64

    // HeapObjects is the number of allocated heap objects.
    //
    // Like HeapAlloc, this increases as objects are allocated and
    // decreases as the heap is swept and unreachable objects are
    // freed.
    HeapObjects uint64

    // StackInuse is bytes in stack spans.
    //
    // In-use stack spans have at least one stack in them. These
    // spans can only be used for other stacks of the same size.
    //
    // There is no StackIdle because unused stack spans are
    // returned to the heap (and hence counted toward HeapIdle).
    StackInuse uint64

    // StackSys is bytes of stack memory obtained from the OS.
    //
    // StackSys is StackInuse, plus any memory obtained directly
    // from the OS for OS thread stacks (which should be minimal).
    StackSys uint64

    // MSpanInuse is bytes of allocated mspan structures.
    MSpanInuse uint64

    // MSpanSys is bytes of memory obtained from the OS for mspan
    // structures.
    MSpanSys uint64

    // MCacheInuse is bytes of allocated mcache structures.
    MCacheInuse uint64

    // MCacheSys is bytes of memory obtained from the OS for
    // mcache structures.
    MCacheSys uint64

    // BuckHashSys is bytes of memory in profiling bucket hash tables.
    BuckHashSys uint64

    // GCSys is bytes of memory in garbage collection metadata.
    GCSys uint64 // Go 1.2

    // OtherSys is bytes of memory in miscellaneous off-heap
    // runtime allocations.
    OtherSys uint64 // Go 1.2

    // NextGC is the target heap size of the next GC cycle.
    //
    // The garbage collector's goal is to keep HeapAlloc ≤ NextGC.
    // At the end of each GC cycle, the target for the next cycle
    // is computed based on the amount of reachable data and the
    // value of GOGC.
    NextGC uint64

    // LastGC is the time the last garbage collection finished, as
    // nanoseconds since 1970 (the UNIX epoch).
    LastGC uint64

    // PauseTotalNs is the cumulative nanoseconds in GC
    // stop-the-world pauses since the program started.
    //
    // During a stop-the-world pause, all goroutines are paused
    // and only the garbage collector can run.
    PauseTotalNs uint64

    // PauseNs is a circular buffer of recent GC stop-the-world
    // pause times in nanoseconds.
    //
    // The most recent pause is at PauseNs[(NumGC+255)%256]. In
    // general, PauseNs[N%256] records the time paused in the most
    // recent N%256th GC cycle. There may be multiple pauses per
    // GC cycle; this is the sum of all pauses during a cycle.
    PauseNs [256]uint64

    // PauseEnd is a circular buffer of recent GC pause end times,
    // as nanoseconds since 1970 (the UNIX epoch).
    //
    // This buffer is filled the same way as PauseNs. There may be
    // multiple pauses per GC cycle; this records the end of the
    // last pause in a cycle.
    PauseEnd [256]uint64 // Go 1.4

    // NumGC is the number of completed GC cycles.
    NumGC uint32

    // NumForcedGC is the number of GC cycles that were forced by
    // the application calling the GC function.
    NumForcedGC uint32 // Go 1.8

    // GCCPUFraction is the fraction of this program's available
    // CPU time used by the GC since the program started.
    //
    // GCCPUFraction is expressed as a number between 0 and 1,
    // where 0 means GC has consumed none of this program's CPU. A
    // program's available CPU time is defined as the integral of
    // GOMAXPROCS since the program started. That is, if
    // GOMAXPROCS is 2 and a program has been running for 10
    // seconds, its "available CPU" is 20 seconds. GCCPUFraction
    // does not include CPU time used for write barrier activity.
    //
    // This is the same as the fraction of CPU reported by
    // GODEBUG=gctrace=1.
    GCCPUFraction float64 // Go 1.5

    // EnableGC indicates that GC is enabled. It is always true,
    // even if GOGC=off.
    EnableGC bool

    // DebugGC is currently unused.
    DebugGC bool

    // BySize reports per-size class allocation statistics.
    //
    // BySize[N] gives statistics for allocations of size S where
    // BySize[N-1].Size < S ≤ BySize[N].Size.
    //
    // This does not report allocations larger than BySize[60].Size.
    BySize [61]struct {
        // Size is the maximum byte size of an object in this
        // size class.
        Size uint32

        // Mallocs is the cumulative count of heap objects
        // allocated in this size class. The cumulative bytes
        // of allocation is Size*Mallocs. The number of live
        // objects in this size class is Mallocs - Frees.
        Mallocs uint64

        // Frees is the cumulative count of heap objects freed
        // in this size class.
        Frees uint64
    }
}
尽管文档有比较详细的描述,但是有些字段理解起来依然很模糊,需要结合Golang runtime的内存管理机制来理解,本文就以此契机来深入了解下Golang1.13的内存管理。
几个重要的数据结构
mspan
Golang的内存管理是基于google tcmalloc的实现,会把不同size划分成一些size class,内存分配是根据需要的size找到最小能满足的size class,而mspan简单来的说是数页(虚拟页,大小是8KB)内存空间,根据指定的size class拆分成可用的大小相等的obj等待分配。 所有size class:
// class  bytes/obj  bytes/span  objects  tail waste  max waste
//     1          8        8192     1024           0     87.50%
//     2         16        8192      512           0     43.75%
//     3         32        8192      256           0     46.88%
//     4         48        8192      170          32     31.52%
//     5         64        8192      128           0     23.44%
//     6         80        8192      102          32     19.07%
//     7         96        8192       85          32     15.95%
//     8        112        8192       73          16     13.56%
//     9        128        8192       64           0     11.72%
//    10        144        8192       56         128     11.82%
//    11        160        8192       51          32      9.73%
//    12        176        8192       46          96      9.59%
//    13        192        8192       42         128      9.25%
//    14        208        8192       39          80      8.12%
//    15        224        8192       36         128      8.15%
//    16        240        8192       34          32      6.62%
//    17        256        8192       32           0      5.86%
//    18        288        8192       28         128     12.16%
//    19        320        8192       25         192     11.80%
//    20        352        8192       23          96      9.88%
//    21        384        8192       21         128      9.51%
//    22        416        8192       19         288     10.71%
//    23        448        8192       18         128      8.37%
//    24        480        8192       17          32      6.82%
//    25        512        8192       16           0      6.05%
//    26        576        8192       14         128     12.33%
//    27        640        8192       12         512     15.48%
//    28        704        8192       11         448     13.93%
//    29        768        8192       10         512     13.94%
//    30        896        8192        9         128     15.52%
//    31       1024        8192        8           0     12.40%
//    32       1152        8192        7         128     12.41%
//    33       1280        8192        6         512     15.55%
//    34       1408       16384       11         896     14.00%
//    35       1536        8192        5         512     14.00%
//    36       1792       16384        9         256     15.57%
//    37       2048        8192        4           0     12.45%
//    38       2304       16384        7         256     12.46%
//    39       2688        8192        3         128     15.59%
//    40       3072       24576        8           0     12.47%
//    41       3200       16384        5         384      6.22%
//    42       3456       24576        7         384      8.83%
//    43       4096        8192        2           0     15.60%
//    44       4864       24576        5         256     16.65%
//    45       5376       16384        3         256     10.92%
//    46       6144       24576        4           0     12.48%
//    47       6528       32768        5         128      6.23%
//    48       6784       40960        6         256      4.36%
//    49       6912       49152        7         768      3.37%
//    50       8192        8192        1           0     15.61%
//    51       9472       57344        6         512     14.28%
//    52       9728       49152        5         512      3.64%
//    53      10240       40960        4           0      4.99%
//    54      10880       32768        3         128      6.24%
//    55      12288       24576        2           0     11.45%
//    56      13568       40960        3         256      9.99%
//    57      14336       57344        4           0      5.35%
//    58      16384       16384        1           0     12.49%
//    59      18432       73728        4           0     11.11%
//    60      19072       57344        3         128      3.57%
//    61      20480       40960        2           0      6.87%
//    62      21760       65536        3         256      6.25%
//    63      24576       24576        1           0     11.45%
//    64      27264       81920        3         128     10.00%
//    65      28672       57344        2           0      4.91%
//    66      32768       32768        1           0     12.50%
size class 对应mspan:
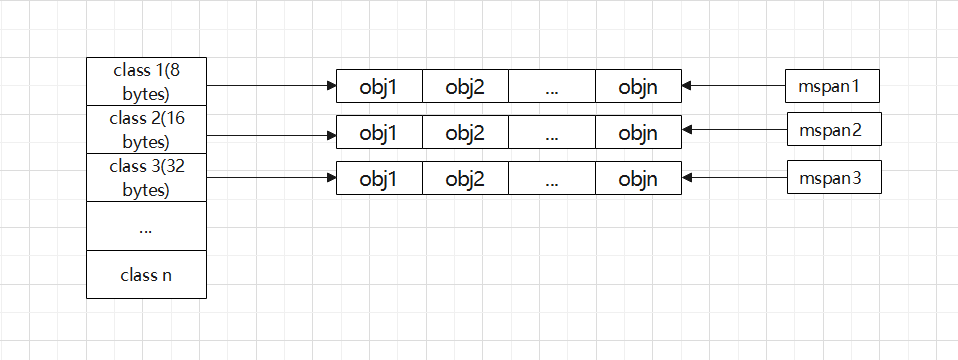
实际上mspan不仅是按照size class来分类,还会按照obj是否noscan来分类,size class + noscan作为key,叫做span class。这样做是为了提高gc效率,因为noscan的mspan可以不用扫描。
func makeSpanClass(sizeclass uint8, noscan bool) spanClass {
	return spanClass(sizeclass<<1) | spanClass(bool2int(noscan))
}
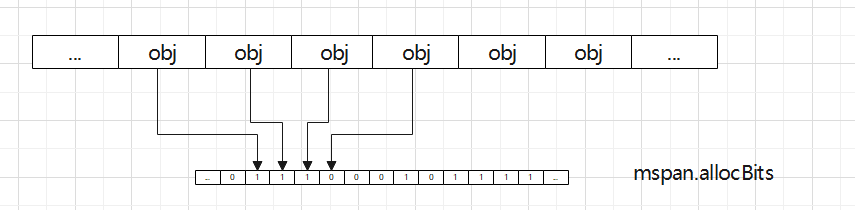
mspan.allocBits是一个位图,标记是否某个obj已分配,每个obj index对应一位,1表示已分配,0表示未分配,真正分配的时候从mspan.freeindex开始遍历,直到找到第一个未分配的obj返回,其中为了提高效率做了些优化,比如mspan.allocCache是最近使用的allocBits的8字节cache:
mspan中其他几个常用字段的意思:
allocCount:已经分配了多少个obj;
nelems:总共有多少个obj;
startAddr:mspan中管理的内存的起始地址,用于计算obj的地址;
npages:mspan中总共管理多少页内存;
mcache
mcache可以认为是每个P(Go的虚拟核心)私有的内存cache,不与其他P共享,因此访问不需要加锁,效率最高。它包含:
- alloc: span class到mspan的映射map;
- tiny, tinyoffset: 微小内存(<=16字节)管理;
在mcache中的分配流程(可见malloc.go:mallocgc的实现)按照分配的size会有不同的逻辑:
- 微小内存分配:size<=16字节,且分配的对象不包含指针(gc时不需要扫描)会根据当前tinyoffset判定tiny中是否有足够内存分配,如果有则直接切走返回,如果没有则去size class为16字节的mspan中分配一个空闲obj,从obj中切走指定size,如果还有剩余则cache到tiny中以备下次使用;
- 小内存分配:size<=32KB,先根据size找到对应的size class,再通过alloc映射表找到对应的mspan,从mspan中分配出一个空闲的obj,如果这个mspan不存在任何空闲的obj,会往下层请求分配一个可用的mspan(这个后文会描述)放到mcache中替换老的mspan,然后用新的mspan分配一个空闲obj;
- 大内存分配:直接从下层分配一个全新的mspan,取第一个obj返回,注意这个mspan并不缓存到mcache中;
我们必须关注的一些细节是:
- mallocgc函数返回的内存往往会比请求的内存要多,这个一个是因为分配的内存地址需要对齐,一个是因为mspan中的obj都是等大小的内存块。
mcentral
mcentral管理同类mspan(span class相同),在多个P之间共享,对其操作需要加锁。mcentral结构主要由两个mspan list构成:
- nonempty: 存放还有可分配obj的mspan;
- empty:存放已经被cache到各个P的mcache中的mspan,也就是不能再分配的mspan;
在上一节mcache分配内存的步骤2中我们讲到,当某个mspan没有任何空闲obj可分配,则会去下层请求,这个请求其实转到了对应的mcentral的cacheSpan函数,这个函数的流程大致是从nonempty摘除一个mspan,放到empty中去,并返回给对应mcache让其使用,还有部分逻辑是在一边触发gc的sweep操作释放obj,因为即便在empty list中的span可能还未sweep,说不定sweep后也能空出可用的span。
我们必须关注的细节是:mcentral管理的内存,对应的是small size classes,也就是上节中的第二种情况。
mheap
mheap属于内存分配的最底层,主要有三个字段:
- central:所有不同span class到对应mcentra的l映射map;
- free:是一个Treap数据结构,所有free span都存放在此,每一个Treap node都存放一个free span;
- arenas:heapArena map,实际是数组,使用arenaIndex做索引来访问;
heap arena
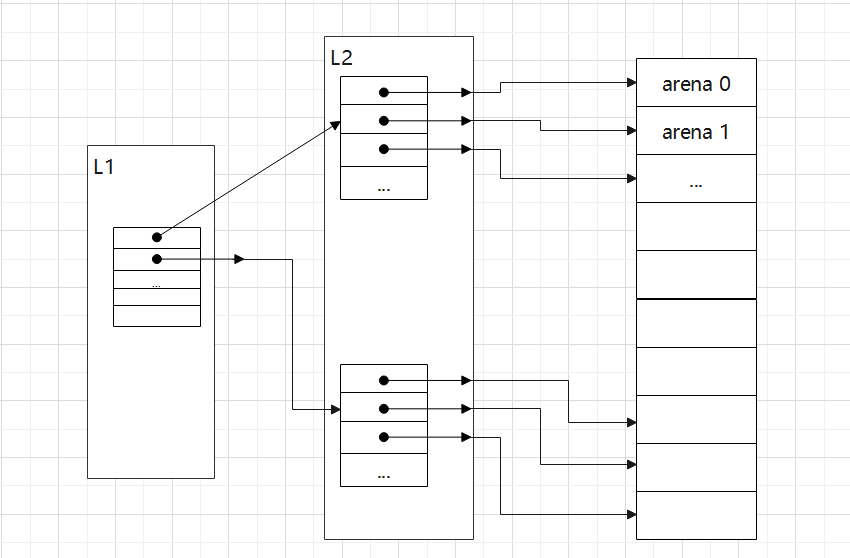
Go把堆空间划分成一块块等大小的arena,叫做heap arena,所有span都是在arena上分配,在64bit系统上这个大小是64MB,每个heap arena的起始地址都是和size对齐的,并且分配器尽量保证arena之间内存连续。数据结构heapArena对应一块arena的元数据,mheap.arenas对所有arena做两层数组索引,两层索引分别叫做L1和L2,在64bit系统上L1为0,可以认为只有L2这层索引。任何地址如果需要找到对应的heapArena,需要先转化为arenaIndex,其实就是算出L1和L2索引:
func arenaIndex(p uintptr) arenaIdx {
	return arenaIdx((p - arenaBaseOffset) / heapArenaBytes)
}

type arenaIdx uint

func (i arenaIdx) l1() uint {
	if arenaL1Bits == 0 {
		// Let the compiler optimize this away if there's no
		// L1 map.
		return 0
	} else {
		return uint(i) >> arenaL1Shift
	}
}

func (i arenaIdx) l2() uint {
	if arenaL1Bits == 0 {
		return uint(i)
	} else {
		return uint(i) & (1<<arenaL2Bits - 1)
	}
}
heapArenaBytes: arena区域的大小; arenaBaseOffset:这个偏移值是因为在amd64中,其实只用了48位地址,高16位虽然没用到,但是需要符号扩展,比如第48位为1的地址,高16位也得是1,所以你得减去一个偏移值0xffff800000000000才能抵消这部分符号扩展;
heap arena map 图示:
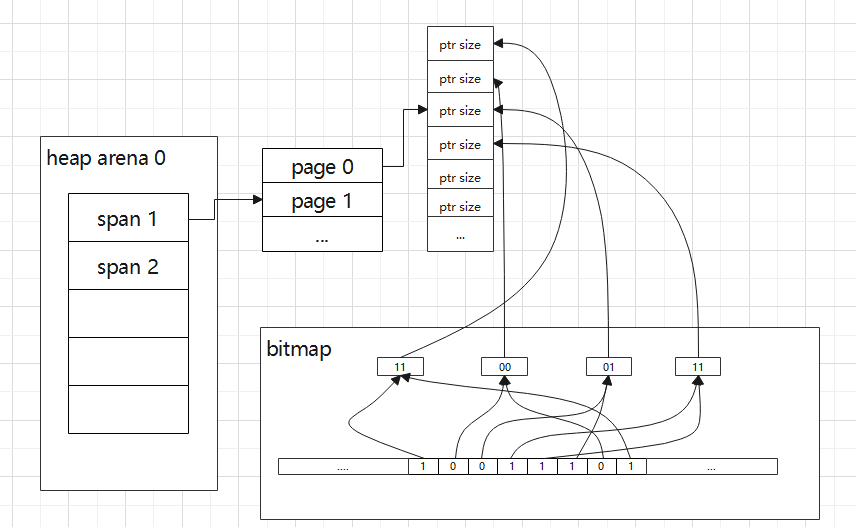
heap arena的元数据:
- bitmap [heapArenaBitmapBytes]byte: 表示这块arena中每指针大小的内存块是否是指针,这个主要是用来给gc扫描用,大致用途是gc标记扫描一个obj时,会按照指针大小步进(假设obj有字段是指针,偏移值必须是按照指针大小对齐的,所以按指针大小步进肯定能遍历到这个指针字段),并假设这个字段是指针,然后将字段的地址映射到bitmap中的位信息来确认,如果是指针,需要把这个字段当作新的obj放入工作队列等待下次扫描(三色标记中的置成灰色)。其实bitmap中用两位表示一个指针大小内存,具体细节如果以后讲gc可以详细描述。这个位信息是在malloc分配内存的时候由传进来的type类型信息来设置;
- spans [pagesPerArena]*mspan: 表示arena中每一页对应在哪个span中,大致用途是先求出某个地址所在heap arena,再求出所在这个arena的哪一页,再根据这个map得到属于哪个mspan,进而求出在这个mspan的哪个obj中,比如gc扫描一个obj发现有一个字段是指针,用这种方式就能得到这个指针所指向的obj;
heap arena 元数据图示:
mheap中的内存分配
上接mcentral中的内存分配流程,在mcentral.cacheSpan函数中,如果取不到任何可用的span,会把请求转发到mheap这层,mheap.alloc函数负责分配指定页大小的全新span,主要流程如下:
- 先从free树中遍历找到一个满足指定页大小的span,由于free树是按照地址大小有序,查找方式是中序遍历,将会找到一个最小地址的满足size大于等于指定页的span;
- 如果步骤1没有找到合适的span,mheap会走到grow函数,通过向系统申请内存(sysAlloc)补充free,再重复步骤1;
- 最后如果找到的span 页数大于需求的页数,需要新创建一个指定页数的span返回,并把free树中的目标span减去指定页数,剩余的以备后用;
这里有必要详细了解下sysAlloc向系统申请内存。在Go中把内存区域标为了4个状态:
- None: 默认初始状态;
- Reserved:指的是被runtime预留的内存,但是还不能直接访问,对应的函数调用是sysReserve,在linux系统中的实现是通过mmap设置prot参数为PROT_NONE;
- Prepared: 还是不能直接访问,但是可以快速转化到Ready状态,对应的函数调用是sysMap,在linux系统中其实是再次调用mmap设置prot参数为可读写了,理论上已经能访问了,windows上这个函数没有实际功能;
- Ready:可以直接访问,对应的函数调用是sysUsed,linux上没有实际逻辑,windows上是commit memory;
sysAlloc分配一个或多个heap arena空间,大小要大于其参数传进来的字节数,分配过程是先调用sysReserve向系统申请保留指定内存空间,再调用sysMap把状态转为Prepared状态,同时为新分配的heap arena空间创建metadata,最后返回Prepared状态的内存首地址。
在grow的流程中新分配的内存空间会尝试和在地址空间上处于前后的span合并,然后再插入进free树中。
内存释放
Go程序中使用的内存主要是在GC时释放的,具体来说主要有下面几个释放流程:
- 在GC的mark termination阶段,每个P的mcache会清空,对应的mcentral中的span会从empty list放入nonempty list中成为可用状态;
- 在GC的sweep阶段,会sweep各个unswept spans,如果这个span中还有已分配的obj在被引用,但是仍有obj未分配,确保放入对应mcentral的nonempy list中以备后用,如果这个span都空了,整个span都需要释放,可以释放到更下层mheap中去,确切的说是放到mheap中的free树中,同时释放的时候也会尝试和在地址空间上邻近的span合并。sweep过程是在独立后台goroutine中持续进行,直到下个GC周期开始时在执行sweep termination流程后结束(具体可见函数调用gcStart->finishsweep_m);
- 后台scavenger goroutine根据一定策略每隔一段时间清扫一定内存,这部分内存会直接释放给系统,不像1,2两种释放其实内存还是在runtime的堆中,具体来说调用了sysUnused,这个函数在linux中的实现是以参数DONTNEED调用madvise,并不是说内存立即释放,在top中也不一定能立即看到RSS的下降,这个仅是一个advise,通知系统支持这块内存区域的物理页不需要了,系统有自己的策略去回收。runtime/debug中的FreeOSMemory函数可以主动触发一次这个释放过程,并且是尽可能释放free树中的空闲内存;
可以看出来释放过程是分配过程的逆过程,内存分配时从系统流转过来,在不同层级cache,释放时又会释放不同层级的cache,最终流转回系统。为什么内存有这么多cache,主要是为了分配效率更高,类似CPU的L1/L2/L3 cache原理。
有一个值得注意的细节是:在free树中的span内存有可能是非ready状态,也就是从free树中分配下来的span可能需要调用sysUsed变成ready状态才能使用,这个是根据mspan.scavenged来判断的。具体原因是从系统刚分配出来的内存和scavenger释放给系统的内存状态(虽然释放了但还是作为scavenged的mspan在free树中)都是非ready状态。
runtime内存统计
回到文章开头的问题,runtime本身有非常详细的内存各种数据统计,在阐述了整个内存管理机制后,我们可以更深入理解MemStats结构中一些字段代表的具体意义了。
- HeapAlloc:已经分配的obj总字节数,包括被引用着的obj和还没来得及被GC清理的未被引用的obj。大致计算方式是,首先统计历史总共分配了多少字节,mcentral记录了这个spanClass已经分配了多少个obj,乘以对应size然后累加起来,这种方式会把cache到mcache中的mspan的所有obj统计到这个分配总数中,但是其实按照我们前文所述并不是所有obj都被分配了,然后统计历史总共释放了多少字节(gc sweep总共free了多少字节),span的sweep流程中会把释放obj个数统计到mcache.local_nsmallfree的对应sizeClass中,在gc mark termination阶段再统计到代表历史总释放的mheap.nsmallfree中,最后历史总分配减去历史总释放即得到HeapAlloc;
- HeapSys: 向系统申请分配的虚拟内存地址总空间,包括那些可能背后没有映射到物理内存的空间,主要是在sysAlloc中调用sysMap增长,注意即便scavenger调用sysUnused也不会减少这个值;
- HeapIdle:包括所有空闲的span,没有分配任何obj,放在mheap.free树中,mheap分配span的时候会降低这个值;
- HeapInuse: 包括所有正在使用的span,也即只要有一个obj被分配了,这个span都会被记录,这个字段和HeapAlloc的区别是,HeapInuse还包含那些还未分配给mcache的span,可以认为统计的是mcentral中所有的span;
- HeapReleased: 返还给OS的物理内存,就是上文中所述的scavenger调用sysUnused的内存,当然分配的Prepared状态的内存也会预先算在HeapReleased中,等待变成Ready状态被使用再被减去;
一些值得注意的细节:
- 在runtime中使用HeapSys-HeapReleased代表对RSS的估计;
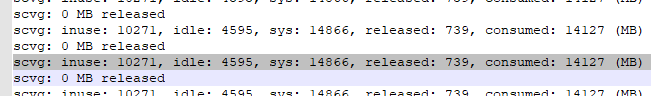
- 设置环境变量GODEBUG=’gctrace=1’会每隔一段时间打印scavenger工作时的一些统计日志,包括HeapSys,HeapIdle,HeapInuse,HeapReleased字段,如下:
Memory Profiler 原理
在Go中对内存做性能分析,一般会用到pprof工具,比如在import “net/http/pprof”并启动一个http server后,就可以如下方式获得性能分析结果:
go tool pprof http://localhost:6060/debug/pprof/heap
但是通常在profile中显示的内存占用不仅与系统中显示的RSS差距很大,还和runtime.MemStats中显示的内存占用差距较大,这主要原因是Memory Profiler的机制是在分配内存时进行采样,并不是说每一次mallocgc调用都会触发一次采样,当然这个采样频率是受一个变量控制的,MemProfileRate控制采样频率,设置为1会导致每次分配都会触发采样,实测非常影响性能,几乎程序跑不起来,默认值是512*1024,可以大致认为是每512K采一次样,实际是更精细复杂的控制。可以通过设置环境变量GODEBUG=’memprofilerate=1’来控制变量值为1。
Memory Profiler统计内存分配是实时统计,但是由于内存释放是在gc sweep阶段才释放,不是说某个obj程序说不用了会立即可以释放,如果我们对内存占用做实时快照肯定会得到内存占用偏高的结论。因为刚分配的内存最快释放的时机是在下一次gc mark termination之后gc sweep持续工作的一段时间里的某一个时刻里面发生,所以profiler以gc mark termination时机作为时间参考坐标,这之前分配的内存和这之后下次gc前发生的内存释放处于一个快照中进行内存统计。
具体实现是分配的时候以调用堆栈的各个函数的pc地址作hash,到一个hash表中索引一个bucket(带调用堆栈pc列表),记录此次分配字节数,并且在span上记录这个分配的obj对应的bucket,当obj在gc sweep释放时,找到对应的bucket记录此次释放,同时同一个bucket中的内存分配和释放的记录要按照同一个快照匹配记录,不能是这个周期的释放统计到另一个周期里面去了。在每一个gc mark termination时都会把当前快照的统计记录到一个历史总的(active)统计里面去,外面接口获取的当前memory profile,即获得的是这个active统计,反应的是当前最新的内存使用情况。
结论
可以看出来Go的堆内存管理主要是分层管理,类似CPU的多级cache,最近的访问效率越高,资源越少越贵,算法有些类似常用的Buddy和Slab算法,同时对多核多线程用况做了优化,总体来说设计简单清晰,复杂度多是GC带入的,如果没有GC就像C++ tcmalloc,实现会更加精简。